Settings
In the following section the properties panel and all settings are described in detail.
Properties panel
The extension can be configured within Qlik Sense when the worksheet is in edit mode.
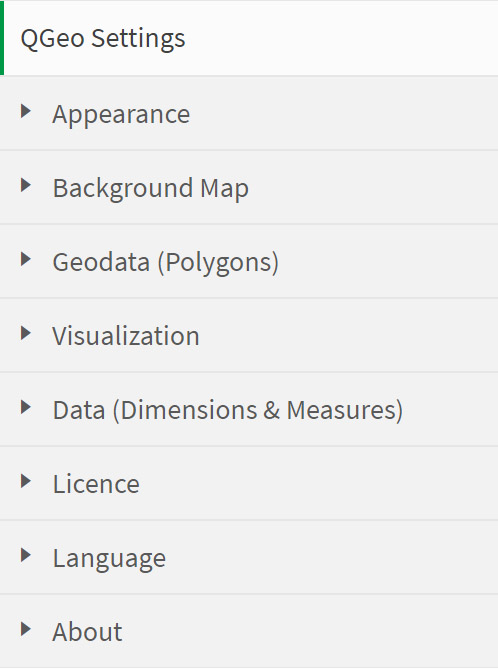
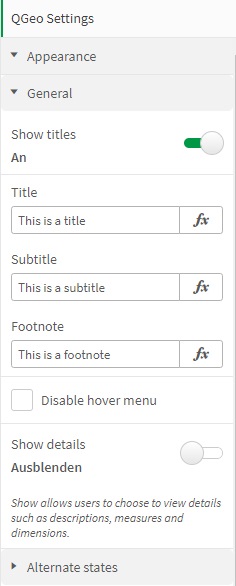
Appearance
Within the „Appearance“ panel general extension settings (e.g. to set title, set undertitle, set footnote) can be configured.
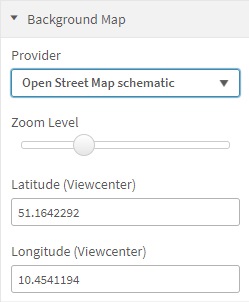
Background Map
Within the „Background Map“ panel different background map provider can be choosen. Additionally the zoom level and the center of the map view (as latitude, longitude) can be set. By default „Open Street Map schematic“ is selected as background map provider.
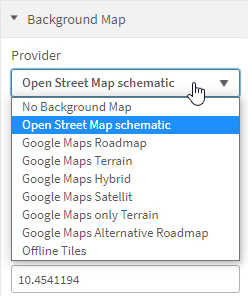
Offline tiles allow a background map of the world to be displayed without an internet connection. In order to reduce the size of the extension file, not all zoom levels of the world map were saved as offline tiles. This must/can be expanded if necessary.
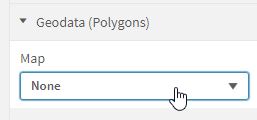
Geodata (Polygons)
Within the „Geodata“ panel different ready to use Maps & Geospatial Data can be selected.
Select map and identifier
Each map file contains at least one identifier which also must be selected. Values of the selected identifier must match the dimension values to visualize and color polygons according to a selected kpi/measure. There are different options to select a map file and an identifier.
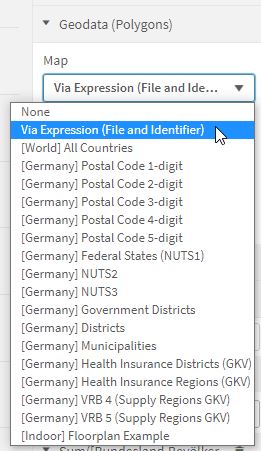
Option 1: Select map and identifier via drop down
The map [Germany] Federal Stats (NUTS1) for example contains three possible identifier NUTS_LEVEL, NUTS_CODE and NUTS_NAME where the identifier „NUTS_NAME“ represents the name of the federal state (e.g. Sachsen).
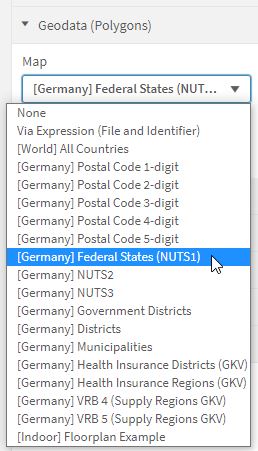
Select map file via drop down menu
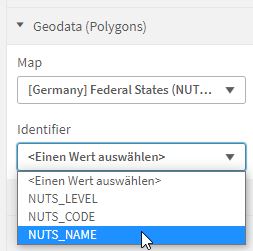
Select identifier via drop down menu
Option 2: Select map data and identifier via expression
Alternatively map file and identifier can be loaded via expression dynamically. Therefore the expression for the map file needs to return a file path with file name. Of course the associated file needs to be available inside the referenced directory. The expression for the identifier needs to return an identifier as string. An overview about available identifier of the included data can be found within the refer to Maps & Geospatial Data section.
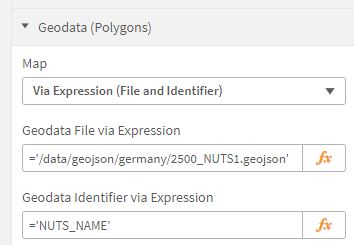
Select map file and identifier via expression
Example for setting the map file for „[Germany] Federal Stats (NUTS1)“ via expression:
='/data/geojson/germany/2500_NUTS1.geojson'
Example for setting the corresponding identifier via expression:
='NUTS_NAME'
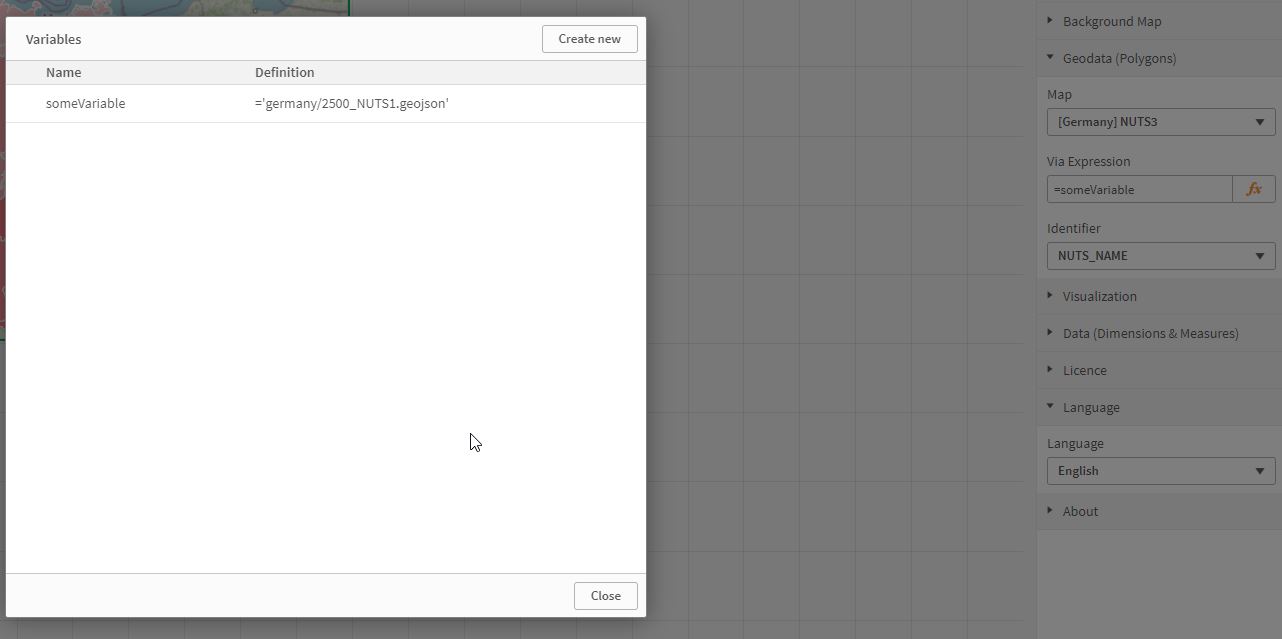
As programmatically approach it is possible to set and change map file as well as identifier in dependence of a Qlik Sense variables. This way also custom map and geodata can be included and visualized.
Visualization
The „Visualization“ panel contains the „Colors“, the „Extras“ and the „Highlight“ panels to configure the visualization of the data and extra map features as popups, labels and highlighting.

Colors
Different settings to configure the coloring and styling of the map and geodata can be found in the „Colors“ panel. With the transparency slider the opacity of the map can be changed. The outline of the map and geodata (polygons) and the label color can be set by using a color picker. Label color is the color of text labels within/on the polygons.
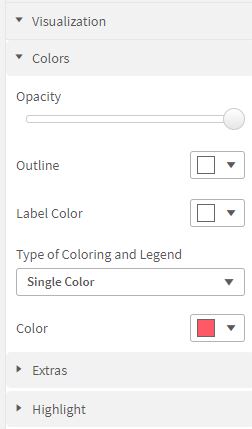
Coloring and legend of the map are coupled, different options for coloring and legend can be selected:
Type of Coloring and Legend |
Description |
|---|---|
Percent |
Percentage ranges can be highlighted with a fixed color. |
Absolute |
Absolute ranges can be highlighted with a fixed color. |
Single Color |
A single color can be selected. A gradient from white to the selected shade is used for visualization. |
Fixed Range (fixed Interval) |
Individual start and stop points can be created, each of which can be assigned a value and a color. The resulting value ranges are colored in the color defined from start to stop point. |
Fixed Range (fixed Interval) with Color Gradient |
Individual start and stop points can be created, each of which can be assigned a value and a color. The resulting value ranges are colored in the color gradient defined from start to stop point. |
Quantile Single Color |
The number of quantiles can be configured. The color gradations and the number of elements in the legend depend on the number of quantiles. |
Extras
The „Extras“ panel allows to enable/disable to show popups and/or to show labels on the map.
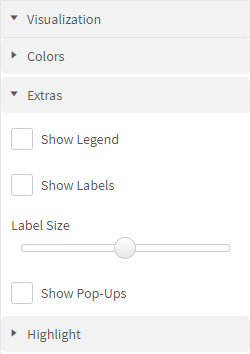
Additionally within the „Data“ panel show popups and/or show labels needs to be enabled for the desired fields (described at Data).
Labels are not shown if the text does not fit in the geometries. If labels are hidden they show up when the zoom level is increased and the text fits into the geometrie.
Option |
Description |
|---|---|
Show Legend |
Toggles the visibility of the legend of the measure. |
Show Labels |
Toggles the visibility of labels. |
Label Size |
Changes the font size of labels. |
Show Pop-Ups |
Toggles the visibility of popups. |
Highlight
The „Highlight“ panel allows to highlight single polygons on the map depending from their kpi/measure.
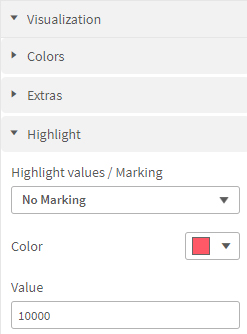
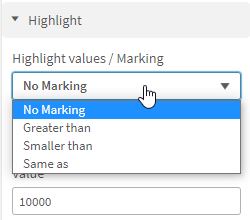
Select options for Highlighting Values / Marking
Option |
Description |
|---|---|
Greater than |
All polygons where the first measure is greater than the entered value will be highlighted. |
Smaller than |
All polygons where the first measure is smaller than the entered value will be highlighted. |
Same as |
All polygons where the first measure is excatly the same as the entered value will be highlighted. |
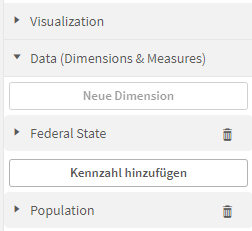
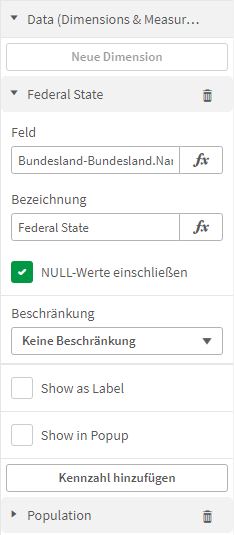
Data (Dimension and Measures)
Within the „Data“ panel the dimension and measures of the extension can be configured. QGeo allows to configure one dimension and multiple measures (to to 24). The selected dimension is used as identifier and needs to match with the selected identifier of the geodata. Within the panel of a dimension and measure the user can configure if to show in popup and/or show as label on the map.
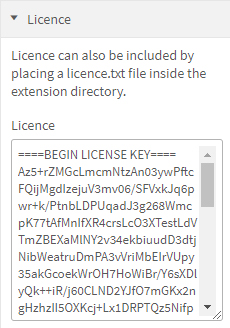
License
Within the „License“ panel a license text/string can be entered. Apart from that option different other options for licensing exist (described at License Management). When entering a license within the properties panel the license is stored inside the worksheet. Which means adding the extension to other worksheets would require to enter a license again. Check out the other options for license management for avoid this.
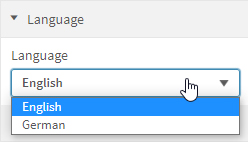
Language
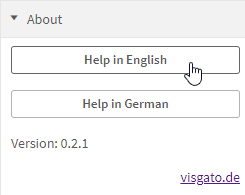
Currently the extension can be set to english or german language. Changing the language settings takes 10 seconds. It loads the translations for all labels used in the extension and changes the Qlik Sense language. Language changes may be displayed after the worksheet is out of edit mode.
About
Additionally to the version of the extension the documentation can be accessed from within the „About“ panel.